UPS implemented another set of zone chart adjustments at the end of December 2025. As with prior updates, UPS did not provide shipper-specific details on what changed, which origin ZIP codes were affected, which zones increased, or how broad the impact may be.
So we did what we’ve done before: pulled the charts, compared the before/after, and measured the shifts ourselves.
UPS Zone Charts Have Been Adjusted 5 Times Since 2023
This is the fifth time UPS has made these types of zone chart changes since 2023:
- December 2023
- June 2024
- October 2024
- March 2025
- December 2025 (most recent)
At this point, it’s not a one-off adjustment- it’s a trend.
When changes happen this often, the impact starts to compound, especially for shippers who price, forecast, and negotiate based on what they think their “normal” zone distribution looks like.
As with our previous work, we compared UPS zone charts before and after the end-of-December 2025 changes went into effect.
We used 70 origin zip codes across the U.S. – locations that commonly represent major distribution and fulfillment markets, including:
Los Angeles, Salt Lake City, Chicago, Indianapolis, Dallas, Atlanta, Memphis, Phoenix, Columbus, and Metro NY/NJ (plus many more).
Key Findings: Zone Changes Skewed Upward
Across the 70 origins analyzed:
- 388 total zone changes
- 275 changes (71%) moved to higher zones
For comparison, during the last major update in June 2025 (using the same 70 origin zips):
- 1,081 total zone changes
- 690 changes (63.8%) moved to higher zones
While the total number of changes in December 2025 was lower than in June 2025, that does not guarantee the impact is smaller.
Regarding the actual zone changes, the following chart shows the distribution of zone-to-zone jumps.
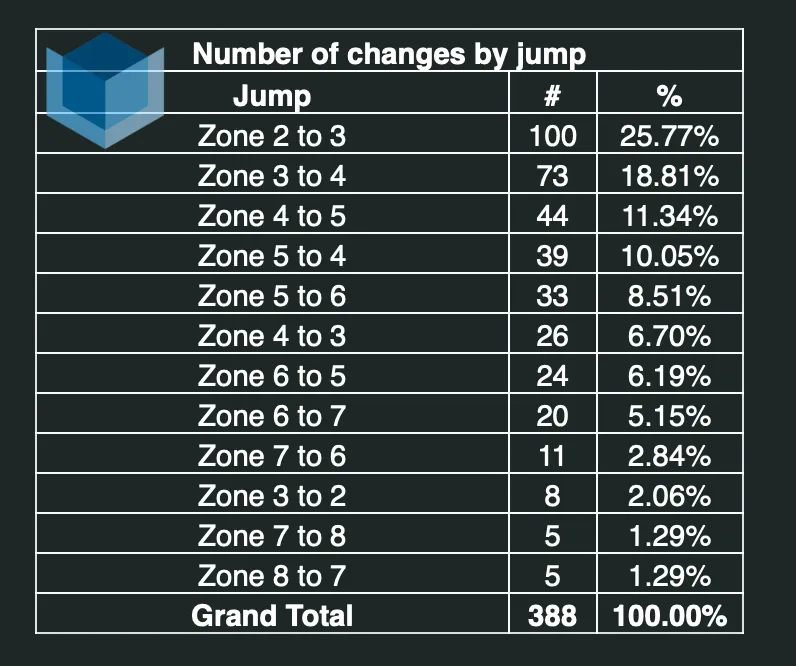
*The majority of zone changes were found in zips 114 (Queens, NY), 850 (Phoenix, AZ), 907 (Long Beach, CA), and 400 (Louisville, KY).
This New Change May Hit Short-Zone Shippers Harder
Here’s the part shippers can’t afford to miss:
In June 2025, about 36% of zone increases occurred in Zones 2 and 3.
This time, 63% of the zone increases occurred in Zones 2 and 3.
That’s a major shift toward short-zone impact.
Short-zone shipments are often where shippers have:
- the highest density
- the most predictable volume
- …and in many cases, the least operational flexibility
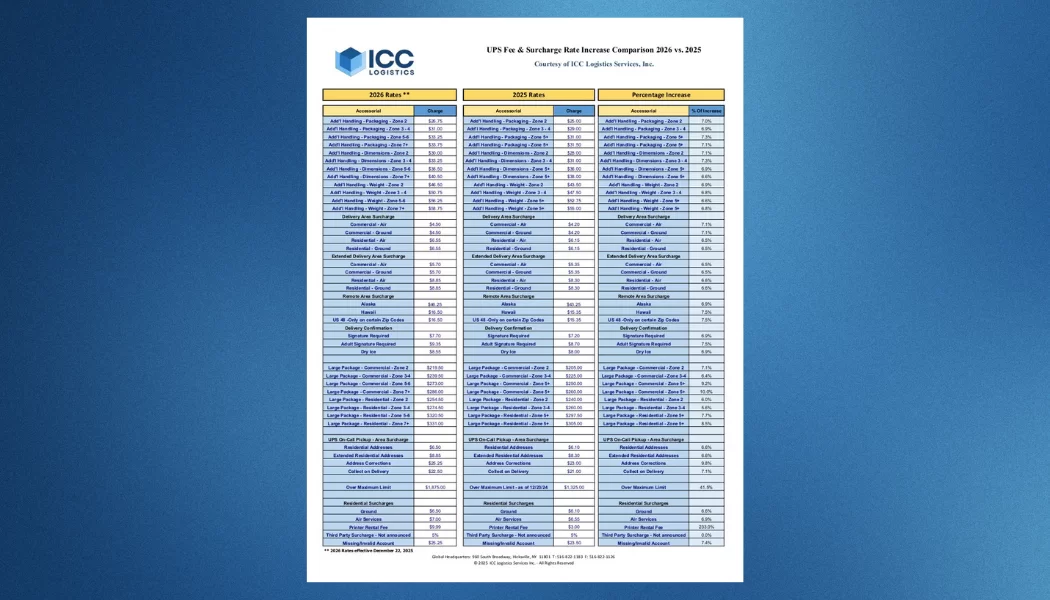
Cost Impact:
Our analysis shows that cost increases on short-zone Ground shipments can be close to 30% for heavier-weight packages.
That’s not a rounding error, that’s budget-breaking for the wrong profile.
It’s also important to note that previous analysis that we had performed showed that zones experiencing increases had much larger populations than zones that saw decreases.
What Shippers Should Do Now
To assess the impact, shippers need to perform a comprehensive analysis of the volume they are shipping to affected zip codes.
Given how often UPS has made zone chart changes since 2023, we expect they’ll do it again in 2026. It’s one of the quieter levers carriers can pull to improve profitability without calling it a rate increase.
Need help quantifying the impact?
Our analysts are here to assist any shippers who are interested in determining the specific impact these changes have had on their volume and costs. Email TBinkis@ICCLogistics.com for more information, or fill out the form below, and one of our experts will be in touch.