

FREE EXECUTIVE RESOURCE
The CFO Playbook for Transportation Cost Control
Designed for finance leaders who want to understand — and control — what transportation spend is really costing the business.
Most organizations are losing a meaningful percentage of their freight spend to misaligned contracts, billing errors, and surcharge expansion — quietly, outside the reach of standard financial controls.
This playbook was built to change that.
Who This Is For
Built for Leaders Who Own the P&L
CFOs & VP Finance
Is your transportation spend competitive? Here’s the financial case for finding out.
Controllers & Accounting Managers
A cost category that resists standard controls and rarely surfaces its own inefficiencies.
Manufacturing & Distribution Leaders
High freight-to-revenue ratios where small logistics improvements produce significant margin impact.
E-Commerce & Retail
Free-shipping programs where carrier cost increases compress margins without a visible pass-through.
Medical & Life Sciences
Complex parcel profiles where dimensional, accessorial, and compliance-driven costs require specialized expertise.
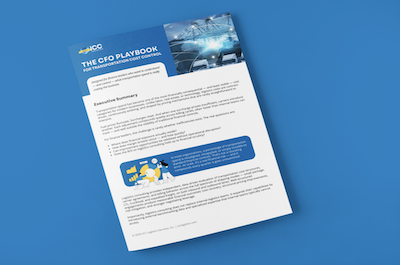
CFO Playbook for Transportation Cost Control
Instant download · PDF
Download Your Free Executive Resource
Enter your details to download.
No spam. No upfront cost. No obligation.
ICC will never share your information.
50+
Years of expertise.
200+
Years of collective team experience.
0%
Upfront consulting fees – Performance-based.
100%
Objective analysis –
Carrier-agnostic.
What’s Inside.
Is This Happening to You?
A pattern-recognition diagnostic for spotting transportation cost leakage before it shows up in your numbers.
The Finance Leader’s Challenge
Why freight spend consistently escapes standard financial controls — and why it’s getting harder to manage without independent data.
Understanding Margin Erosion
How small inefficiencies compound across surcharges, dimensional pricing, and contract drift — and how to tell if it’s happening to you.
Where Financial Leakage Occurs
The five most common sources of transportation cost leakage, ranked by speed of financial recovery.
What This Looks Like on Your P&L
A before-and-after scenario showing what cost misalignment actually costs — and what recovering it means for operating profit.
The Logistics Cost Control Framework
A four-layer model for transportation cost structures that are stable, predictable, and defensible over time.
Evaluating ROI
The financial case for logistics consulting — gain-share models, revenue equivalency, and time-to-value projections.
Five Detailed Success Stories
Documented client engagements with validated outcomes — including $10.97M in cumulative savings from a single engagement.
Logistics Cost Validation Checklist
A structured self-assessment across five categories of financial exposure — built into the playbook.
Success Stories
Real Client Outcomes
Not Projections. Actual Results.
$10.97M
3-Year Cumulative Savings
Commercial equipment manufacturer — enterprise transportation optimization across inbound, plant-to-plant, and outbound lanes. 28% reduction in Year 1 alone.
$4.5M
5-Year Contract Savings
Biomedical company — benchmarking-driven negotiation after years of internal-only contract renewal.
$3.5M
Annual Transportation Savings
Global manufacturer — carrier network rationalized from 100+ providers to fewer than 12. 24% reduction in total logistics spend.
$121K
Recovered in 5 Months
Enterprise parcel shipper — billing discrepancies identified within two weeks of audit initiation following new FedEx contract implementation.
Clients trust ICC because the work is practical, measurable, and delivered without creating more internal burden.
Most clients see refunds within weeks — without switching a single carrier.
Results vary based on shipping volume, carrier mix, and contract structure. ICC will identify what’s realistic for your operation during your Logistics Cost Review.
The Revenue Equivalency Principle
At a 10% net margin, every $1 recovered in transportation costs is the profit equivalent of $10 in revenue — without a single new customer, new headcount, or new infrastructure investment.
Unlike revenue growth, freight savings require no new investment to realize. They flow directly to operating profit the moment they’re recovered — no cost of goods, no SG&A, no friction.
The playbook includes a full profit impact table. Find your margin, see your number.
At 10% margin,$300K saved equals
$3M in Revenue
you no longer have to earn
At 6% margin,$620K saved equals
$10.3M in Revenue
you no longer have to earn
Goes straight to
Operating Profit
No COGS. No SG&A. No friction.
The ICC Framework
Four Layers of Cost Control
Sustainable transportation cost management requires multiple disciplines working in concert — not a single lever.
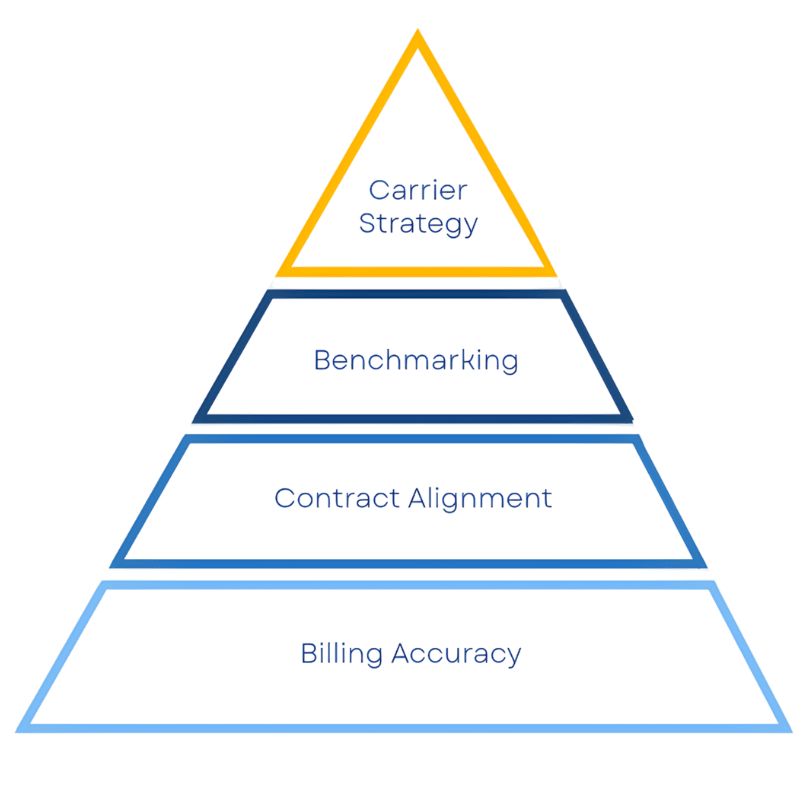
Each layer builds on the one beneath it. Most organizations manage one or two. Few maintain all four.
Start with Clarity, Not Commitment
Download the CFO Playbook and the built-in Logistics Cost Validation Checklist — free, no commitment required.
No spam. No commitment. Just clarity.
Finance leaders can also request a complimentary Logistics Cost Review.